
How many sales calls should your team be making? Most sales managers have a good idea based on their goals and quotas, but how does that compare to the competition? We were wondering the same thing so we checked the numbers.
We did a deep dive on the data to get general industry specific metrics. Snapforce has hundreds of call center customers who use it to power their sales teams. Looking at a random 100 call centers with at least 1,000 calls per day, we did some analysis.
Average calls per sales person by industry
- 42 - Consulting
- 21 - Energy
- 8 - Engineering
- 118 - Insurance
- 133 - Lending
- 30 - Real Estate
- 66 - Technology
- 37 - Transportation
What does the calling data show?
Since we cannot get more granular with the data, it shows us that the majority of outbound calling is done by two industries. It also provides a starting point for the minimum number of calls your outbound callers should be making daily to compete with your industry average. To beat the industry average make double the number of calls for your industry.
Total outbound call volume by industry
- 9.23% Consulting
- 4.61% Energy
- 1.75% Engineering
- 25.93% Insurance
- 29.23% Lending
- 6.59% Real Estate
- 14.51% Technology
- 8.13% Transportation
Keep in mind these are percentages based on this study's data set. Out of the data set analyzed the Lending industry makes the highest number of calls per agent at 29.23%, followed by the Insurance industry at 25.93%.
Average talk time per call by industry
- 2.07 min Consulting
- 3.35 min Energy
- 14.42 min Engineering
- 58 sec Insurance
- 48 sec Lending
- 1.55 min Real Estate
- 1.42 min Technology
- 3.31 min Transportation
The data set also shows that companies in the engineering industry make the smallest number of outbound calls but have the most meaningful engagements. This is clearly shown by the number of outbound calls to the total talk time. The engineering industry has the highest amount of talk time, but the lowest number of calls.
The numbers for the real estate industry show that they average around 30 calls per day for each agent, but the calls are short on average. With the average talk time for a call being just under 2 minutes. This appears to show that these real estate calls are short and the agents spend more time on other activities then talking on the phone.
The transportation and consulting industries both show good bang for their call center buck. Both of these industries show high engagement calls on average. The total number of calls versus the total talk time points to short and concise conversations, and lower hangup rates when compared to other industries.
Average hang-ups by industry
Using the same data set we also analyzed hang-ups by industry.
- 2.4% Consulting
- 0.2% Energy
- 0% Engineering
- 62.5% Insurance
- 27.9% Lending
- 0.7% Real Estate
- 4.1% Technology
- 2.2% Transportation
Our research shows that the insurance industry has the highest hang-up percentage out of all others. A call center's hang-up ratio is important, and should be monitored and managed by the call center administrator or floor manager. It not only leads to a negative reputation but can also cause higher call center costs. Snapforce offers unlimited calling so our customers do not have to worry about the cost factor, but most call centers do. Most carriers and VoIP providers that charge by the minute put a premium on hang-ups (or short calls, sometimes under a certain length). This type of cost can add up quickly.
Reason for Outbound Calls
Our data set does not include call reasons, but there are many research studies out there that have. Take the study by ContactBabel, showing the breakdown of outbound call activity by call centers in 2022.
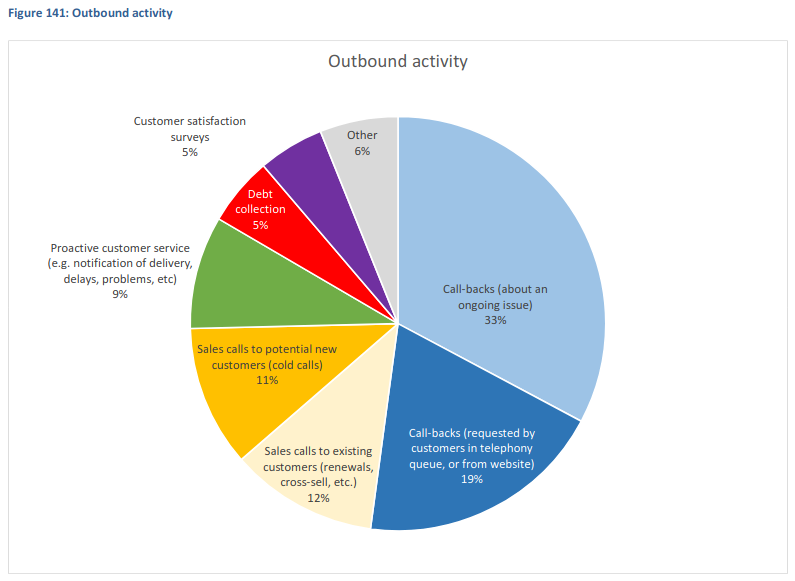 source: ContactBabel
Sales Report Ideas for Outbound Call Centers
Businesses and organizations should maintain good call center reporting. Most call center software systems offer decent reporting capabilities, and provide dashboards or other visual aids to help digest the numbers easily. Using reporting is key to spot trends and pain points in the call center operation, and can help you catch the problem early to boost productivity.
Good reporting goes deeper than just call volume statistics, but also drills down into the underlying data that normally would not be seen. Some examples are:
Number of people spoke to
This is not the total calls, but instead the total number of people or leads each sales person spoke to. Where the sales person may make 100 calls for the day, but only spoke to 28 individual people. That could be because they called the same lead or people multiple times, most likely due to call back requests, or re-trying the same lead after leaving a voicemail earlier. It can also highlight the sales people who are trying to boost their call counts, which is why this type of report is important to include in your daily reports.
The number of people spoke to report is also best used as a daily sales report. When running it for a date range, specifically for a longer period of time, it may lead to confusion for the uneducated observer. That is because when you view reports you look for patterns, and if you run this report for a 7-day period, then run this same report for each day individually over those same 7 days it will not show the same data.
Number of calls per won sale
This report is useful to keep sales people accountable, and boost competitiveness. It's really only useful when you have a sales team or a lot of sales people calling. It is not about looking at each sales person's numbers, but instead use it to highlight the sales people who both suck or are falling behind.
If you only have one or two sales people it's probably not the most useful report and will most likely be more of a negative than a positive. Yes, not all reports are good, some can cause bad morale and bring down the sales floor's vibe.
Number of calls per 5 minute conversation
This is a great report, most call centers do not offer it by default, Snapforce does. Number of calls per $x minute call shows you how many calls it takes for a sales person to have a real meaningful discussion with an opportunity. The report lets you swap out the 5 minute number for whatever fits your situation. If you run this report for your entire call center, and a few of the agents show no data, it's probably time to do some firing.
Conclusion
Managing a sales team or call center is hard work, gaining some insight into your industry's numbers can be useful and hopefully reassuring (I suppose it depends if your team is ahead or behind the industry average). This study provides a benchmark for you to compare your call center against. If the data set we used did not include your industry, stay tuned for future research reports down the road.